Excel Weekly Budgeted Sales Status Report Template – Track Sales Performance Easily
What Is Sales Status Report (Budgeted)?
Every company keeps the check and balance of their company’s transactions through these sales volumes. A Sales Status Report helps them to stay over the top of all the financial activities. It diversifies their vision about making new changes, allowing multitasking and making room for more financial adventures rather than sticking to the same level. The following report is a sample of the Weekly Sales Status Report Template. See also Sales Performance report Template.

How To Make An Effective Sales Status Report Examples?
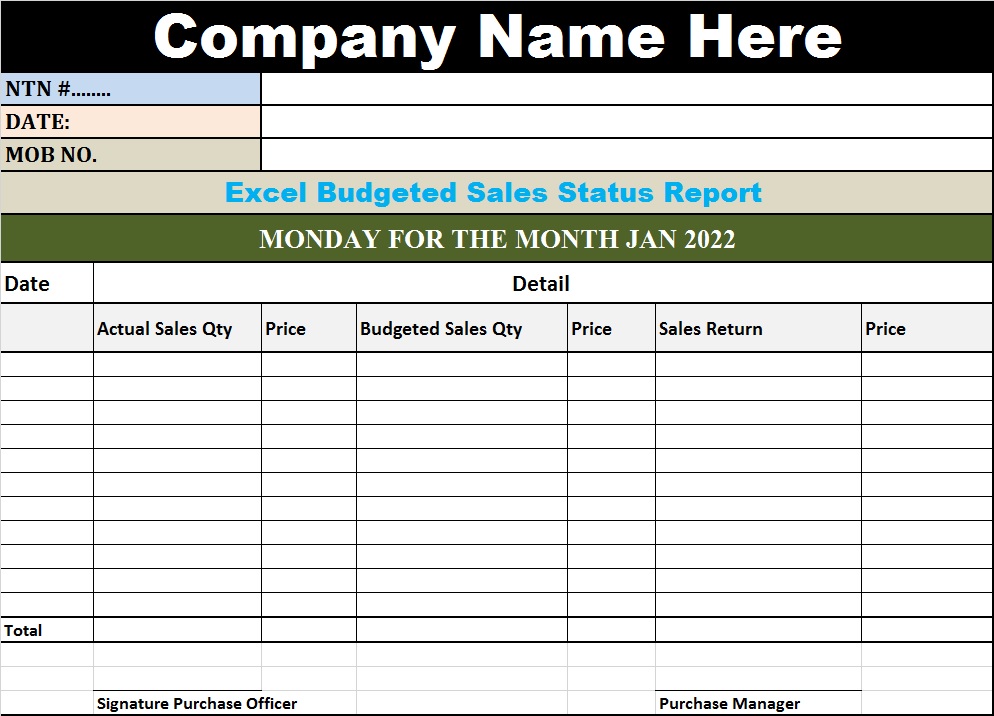
A good Sales Status Report starts with authentic data and verified sources. Mention the pre requisites like name, contact info of the department. Next comes the info area. That’s where you are going to put most of your attention. Write the ‘actual sales qty’ and ‘budgeted sales qty’ defferently to have a more clear and less ambiguous perspective. The prices will be clear and mention the delivery method if possible.
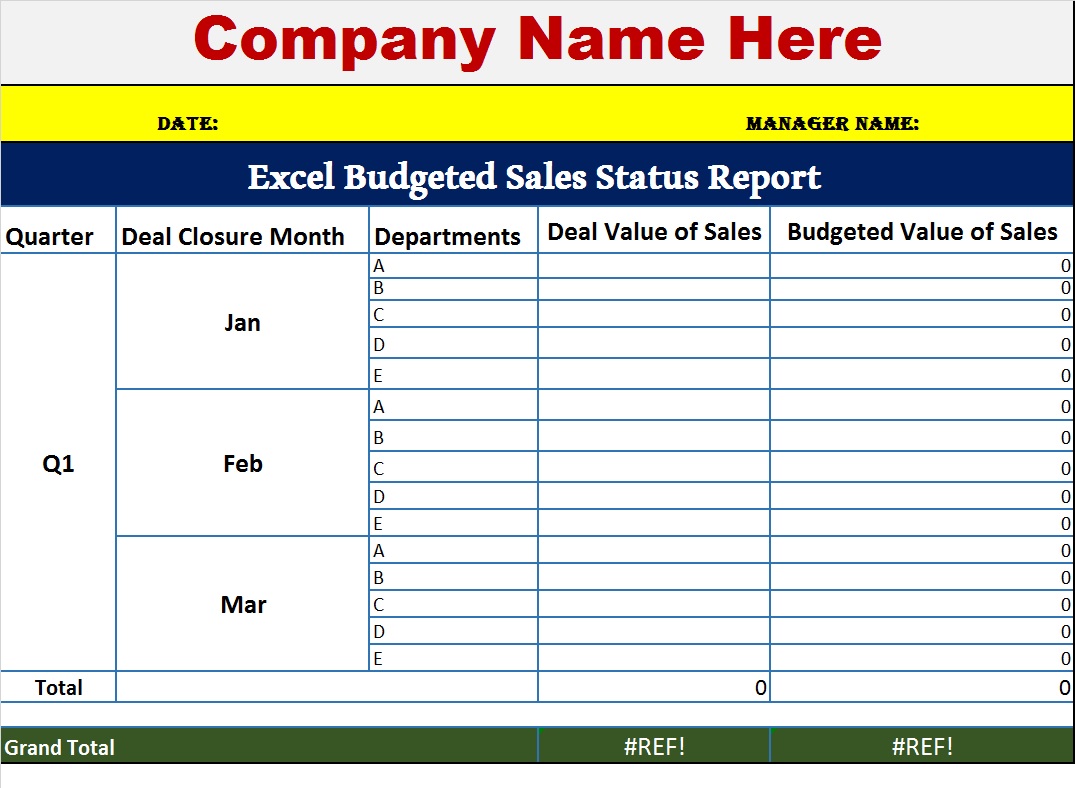
You can also make the report for various department in one as is shown below. choose a department and then discuss if ‘Deal closure month”, “Deal value of Sales”, and “Budgeted Value of sales”
How To Edit And Download Free Sales Status Report Sample?
You can download the templates from the Download button given below each template preview. Now we remind you that these report templates are created MS Excel. You need to have MS Office installed in your system to better edit and customize the templates.
Budgeted Sales vs. Actual Sales
The most important comparison in the report is between budgeted sales and actual sales. The budget represents the amount management expects or plans to achieve, while actual sales represent the revenue generated during the reporting period.
For example, if the weekly sales budget is $25,000 and actual sales are $23,000, the business has a negative sales variance of $2,000.
The Excel formula for calculating sales variance is:
=Actual Sales-Budgeted Sales
If budgeted sales are in cell B2 and actual sales are in C2, the formula would be:
=C2-B2
A positive result indicates that actual sales are higher than the budget, while a negative result indicates that actual sales are lower than the budget.
Sales Achievement Percentage
Another useful measurement is the percentage of the budget achieved. This shows how close the business came to its weekly target.
The formula is:
=Actual Sales/Budgeted Sales
For example, if the budget is $20,000 and actual sales are $18,000, the achievement percentage is 90%.
The result can be formatted as a percentage in Excel. This makes it easier to compare different weeks, even when weekly sales budgets vary.
Multi Department Sales Status Report Examples:
Cumulative Weekly Performance
A strong weekly report should not only show individual weekly results but also provide cumulative information. Cumulative sales show how much revenue has been generated from the beginning of the reporting period through the current week.
For example:
| Week | Weekly Budget | Weekly Actual | Cumulative Budget | Cumulative Actual |
|---|---|---|---|---|
| 1 | $20,000 | $21,000 | $20,000 | $21,000 |
| 2 | $22,000 | $20,000 | $42,000 | $41,000 |
| 3 | $24,000 | $25,000 | $66,000 | $66,000 |
| 4 | $25,000 | $23,000 | $91,000 | $89,000 |
This information provides a broader view of performance. A single weak week may be less significant when cumulative sales remain close to the overall budget.
Key Sections of the Template
A practical Excel weekly budgeted sales report should contain several important columns. These may include: See also Budgeted sales status report.
-
Week or reporting period
-
Product or sales category
-
Budgeted sales
-
Actual sales
-
Sales variance
-
Variance percentage
-
Units budgeted
-
Units sold
-
Average selling price
-
Sales representative or department
-
Notes or comments
Excel Budgeted Weekly Sales Status Report:
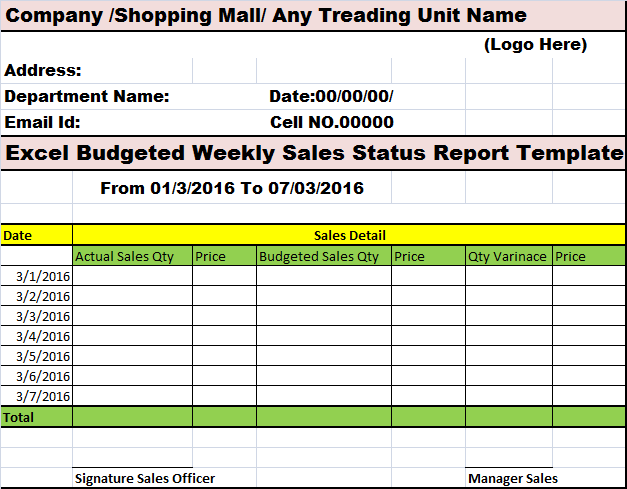
Below you can download the free Excel Budgeted Weekly Sales Status Report Template:
Tips for Creating an Effective Template
Keep the template simple and easy to update. Avoid adding unnecessary information that makes the worksheet difficult to read.
Use consistent formatting for currencies, percentages, dates, and totals. Protect cells containing formulas so they are not accidentally overwritten. Drop-down lists can also be used for product names, departments, or sales representatives.
Frequently Asked Questions (FAQ)
1. What is an Excel Weekly Budgeted Sales Status Report?
An Excel Weekly Budgeted Sales Status Report is a spreadsheet used to compare planned sales targets with actual sales achieved each week. It helps businesses monitor performance and identify sales variances.
2. What should a weekly sales status report include?
A typical report includes the week, sales budget, actual sales, sales variance, achievement percentage, cumulative sales, and performance status. Additional columns can track products, departments, sales representatives, or locations. see also budgeted sales status report.
3. How is sales variance calculated in Excel?
Sales variance is calculated by subtracting budgeted sales from actual sales:
=Actual Sales-Budgeted Sales
A positive result indicates sales above the budget, while a negative result indicates sales below the budget.
4. How do you calculate the sales achievement percentage?
Use the following Excel formula:
=Actual Sales/Budgeted Sales
Format the result as a percentage to show how much of the weekly sales target was achieved.
5. Can the template track sales for multiple weeks?
Yes. The template can contain separate rows for each week or use individual worksheets for different reporting periods. A yearly workbook can track all 52 weeks and calculate cumulative performance.
6. Can the report compare different products or departments?
Yes. Products, departments, branches, or sales representatives can be added as separate categories. This makes it easier to identify differences in performance across the business.
7. Can Excel automatically show whether sales are above or below budget?
Yes. Excel formulas and conditional formatting can automatically display statuses such as Above Budget, On Target, or Below Budget based on predefined criteria.
8. Can charts be added to a weekly budgeted sales report?
Yes. Column charts, line charts, and dashboard graphics can be used to compare budgeted and actual sales and visualize weekly trends.
9. Why is weekly sales reporting important?
Weekly reporting provides more frequent performance information than monthly or quarterly reporting. It helps managers monitor progress, investigate significant variances, and maintain an up-to-date view of sales performance.
10. Can the template be customized?
Yes. An Excel template can be customized with company names, products, sales targets, departments, currencies, formulas, colors, charts, and other business-specific information.
11. Is an Excel weekly sales report suitable for small businesses?
Yes. Excel is particularly useful for small businesses because a simple template can provide structured sales tracking without requiring complex reporting software.
12. How can I make the report easier to understand?
Use clear headings, consistent formatting, automated formulas, conditional formatting, summary totals, and charts. Keeping the report simple and focused on important sales indicators can also improve readability.